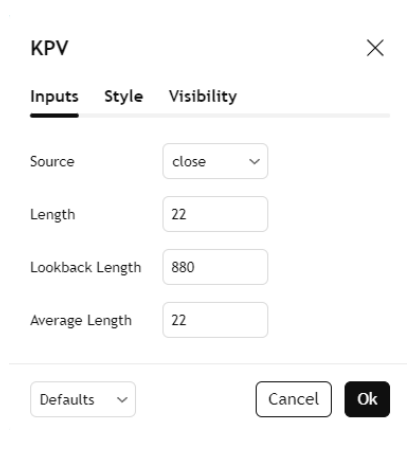
This Pine Script code is an indicator for the TradingView platform that calculates and plots volume percentiles over different time frames (daily, weekly, and monthly). It includes a volume percentile histogram.
Main Code Logic:
Historical Volatility (hvv):
The fHV function is called to calculate the volatility for the logarithmic volume values.
Volume Percentile (hvvp):
The fHVP function calculates the volume percentile based on the calculated historical volatility (hvv).
Percentile Ranks:
prv: The percentile rank of the volume percentile (hvvp) over the last avg periods (to represent the average volume percentile).
prv_1week: The percentile rank of the volume percentile over the last 5 times the avg period (to represent the weekly volume percentile, assuming 5 trading days in a week).
prv_1month: The percentile rank of the volume percentile over the last 22 times the avg period (to represent the monthly volume percentile, assuming 22 trading days in a month).
Volume Percentile Histogram (VV):
The VV variable represents the current value of the volume percentile (hvvp), which is plotted as a histogram. The color of the bars changes depending on the value of VV:
Maroon if above 90
Orange if between 80 and 90
Yellow if between 71 and 79
Green if between 50 and 70
Blu if between 49 and 31
Gray if below 30


