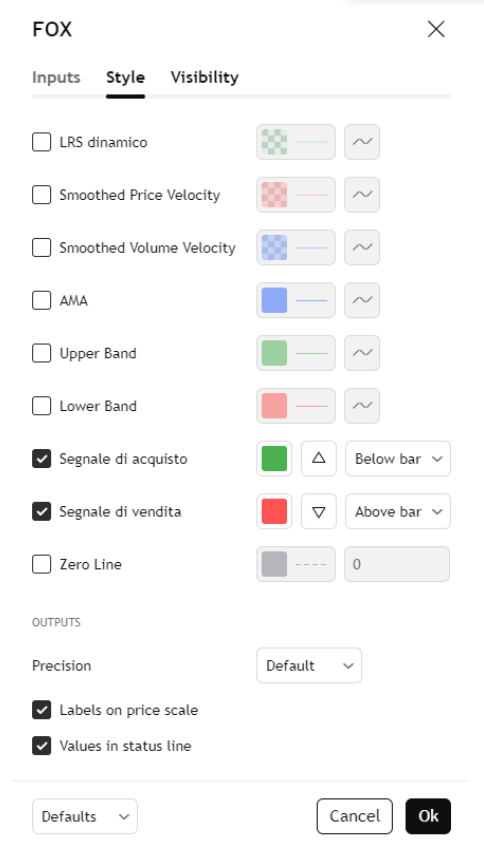

This indicator combines various methodologies to analyze price and volume direction,
generating buy and sell signals based on specific trend and momentum conditions.
It uses an adaptive central line to follow price movements and calculates a dynamic
band representing critical support and resistance levels. The behavior of the price
relative to this band helps determine entry or exit points.
The indicator also analyzes the velocity and variation of volumes, comparing them to
defined thresholds to identify the underlying strength of market movements. Signals are
displayed as symbols on the corresponding bar: green triangles indicate buying
opportunities, while red triangles signal selling opportunities.
By utilizing smoothed lines and adaptive averages, the indicator is designed to filter out
market noise, focusing on significant movements. The parameters are highly
customizable, allowing users to tailor the tool to their specific trading needs and
preferences.
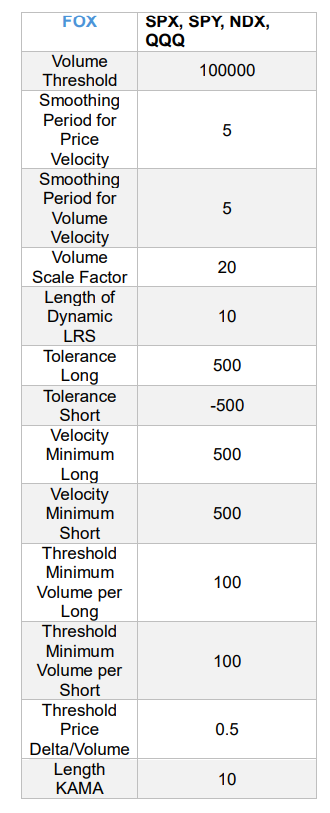
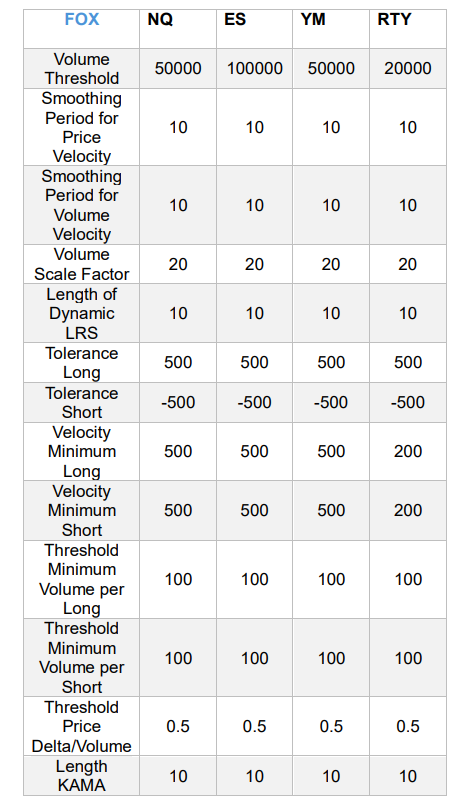
Setup Instructions:
These are the recommended settings on the 5-minute chart: